Introduction
Tracking test failures can be challenging whether the source of the error is in the target application or in the test itself. The techniques described in this paper will help you locate the source of those errors.
Step Run:
The Step Editor contains a ‘Run’ button in the lower portion of the panel, allowing the user to execute each step in the proper target application context.
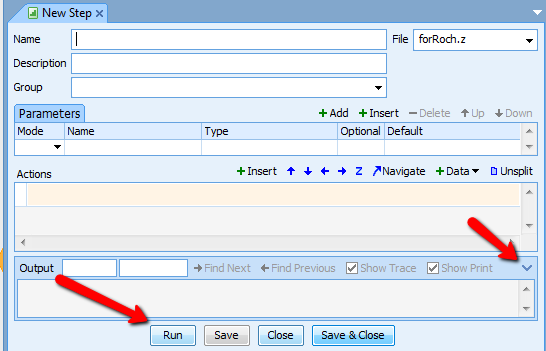
When the step is run, the trace of the execution is displayed in the ‘Output’ panel just above the ‘Run’ button. The ‘Output’ panel can be expanded or collapsed. Independently testing a step is far easier than attempting to test it within the context of a test. However, when a step is run outside of the context of a test, it may fail because AscentialTest (instead of the target application) has the focus. To resolve this problem, add a ‘SetActive’ action for the page or dialog at the top of your step. You can remove it when you are finished debugging.
Call Stack Links:
When an error occurs, AscentialTest provides a call stack for the error. The call stack provides a link to the location of the line in the file where the error occurred. It also includes the line numbers of any calls made to that line. The number of lines in the stack trace will depend on the sequence of calls in your test.
Here is an example of the output that is displayed in the ‘Output’ panel at the conclusion of a step or test execution. You can trace the actions of the execution by reading the action sequence.
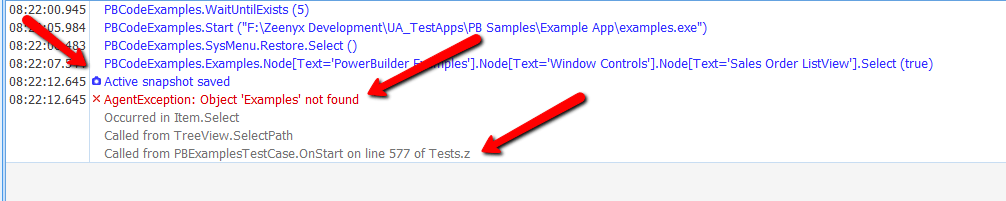
Notice that the error message is displayed in red. In some cases, the error might be the result of a failed verification, but in this example, the error was generated by AscentialTest because the object ‘Examples’ was not found.
Directly below the error message is the call stack. It specifies the action in which the error occurred. In this example, the error occurred in ‘Select’. You can read the full description of the ‘Select’ action just above the line that reads ‘Active snapshot saved’. The call stack also displays the file name and line number where the error occurred. In the example above, the line reads ‘Called from PBExamplesTestCase.OnStart on line 577 of Tests.z’. If the user double-clicks on that line, AscentialTest will navigate to that line so that the context of the error can be better understood. The call stack might display a number of lines depending on the calling sequence used in your tests. Any line that contains a line number can be double-clicked to navigate to that file/line number.
Finally, a camera icon, like the one displayed in the image above, may be displayed. The camera icon indicates that a snapshot was taken at the point of failure. By default AscentialTest takes a snapshot of the target application whenever an ‘object not found’ type error is encountered. If the user double-clicks on the camera icon, the snapshot will be displayed. Having a picture of the target application at the point of failure saves a lot of time when trying to determine the cause of the error. You can configure AscentialTest to take snapshots for verification errors in the ‘Runtime Defaults’ tab of ‘Project Settings’:
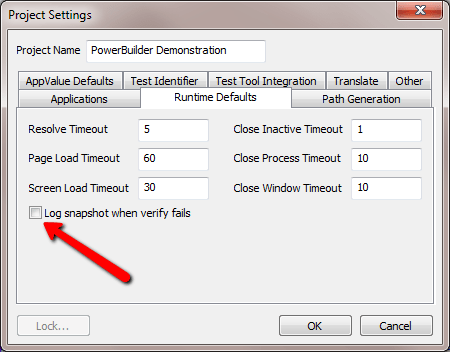
There is also an action called LogSnapshot in the ‘UA’ class that can be called to take a snapshot at any point in the test sequence.
Debugging Class Functions:
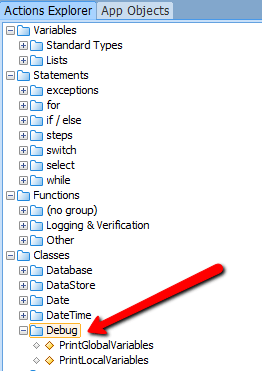
AscentialTest includes two debugging actions that allow the user to print global and local variables. Those actions are located in the Actions Explorer in the ‘Debug’ class section. They can be dragged to a step or test to provide more runtime details.
Additional debugging features will be added to AscentialTest in the future.
Techniques to Improve Error Tracking:
There are other actions that you can take to make locating and debugging errors easier. Here are some of our favorites:
Commenting
Sometimes running a step in isolation is not enough to pinpoint a problem. By commenting out lines in the step that is being debugged, the user can focus on a single action to help determine the cause of an error. To comment a line, right-click on the line and select ‘Comment’ from the context menu:
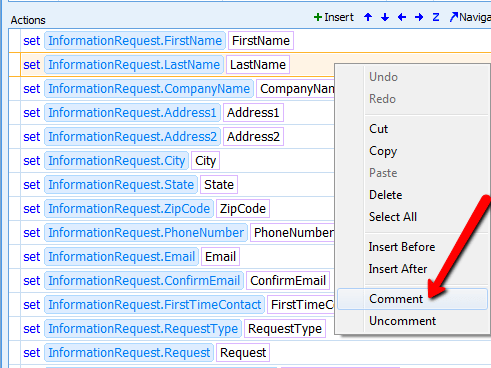
The commented lines will be ignored or skipped at execution time. To comment multiple lines, highlight the group of lines that you want to comment and then right-click to access the context menu.
Halting Test Execution
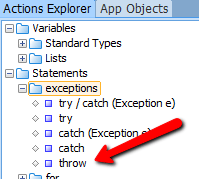
Sometimes it is difficult to follow the sequence of a test because the test continues to run past the point of failure. To halt the execution of a test, insert a ‘throw’ statement at the point where you would like the execution to stop. To insert a ‘throw’ , select it from the Actions Explorer and drag it to the desired line in the step or test:
Provide a message that will be displayed in the results output. In the example below, the message clearly signifies that the test has been stopped deliberately:
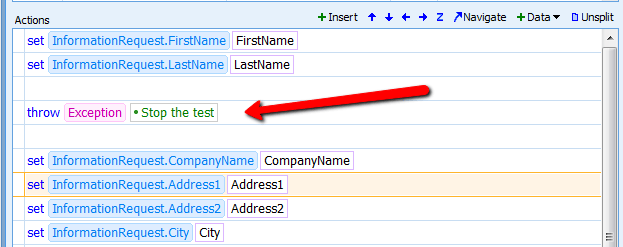
With the test stopped, you can then examine the state of the target application to locate the source of failure. Be sure to remove your ‘throw’ statement when you are finished debugging.
Writing clear error messages
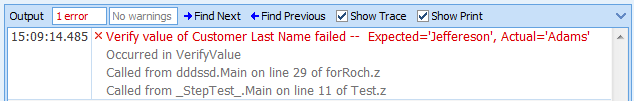
Whether you use a built-in or custom verification action, it is important to provide clear error messages that will be written to the results output if the comparison between the expected and the actual result fails. Let’s look at the built-in action called ‘VerifyValue’:
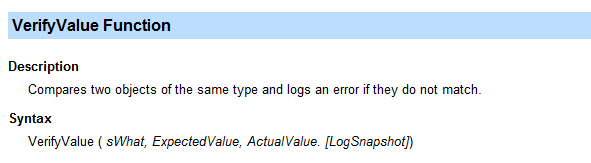
The first parameter of ‘VerifyValue’ provides a way for the user to customize the error that will be logged if the verification fails. ‘sWhat’ describes ‘what’ is being verified. If this parameter is set to the string ‘Customer Last Name’ and the verification fails, the error message will begin with the string ‘Verify value of Customer Last Name failed’ as displayed in the image below:
If you have any questions about debugging tests, please contact Zeenyx Support at [email protected]. We are happy to answer your questions.


 Brian has been working in the field of test automation for more than 30 years. Brian began as a QA Engineer using the testing tools available in the early 1980’s. He joined Segue Software in its infancy and served as the EVP of R&D during that company’s golden years. Brian formed Star Quality, a consulting firm specializing in test automation in the late 90s. After 12 years of experience in the trenches, he’s excited to be building the next generation testing tool that will increase the productivity and and effectiveness of test and development teams.
 Dave is a pioneer in the field of automated testing. Dave developed ATF, one of the first automation tools, more than 20 yeas ago. He was a founder and Chief Architect of Segue Software, Inc., the original creators of QA Partner/SilkTest. Dave believes that no testing tool can be easy to use without a solid foundation. That’s why he is committed to providing AscentialTest’s universal agent with the most powerful object recognition engine in the industry.